

Performance Review: Week 1
Performance Review: Week 1
Slicing and dicing the data from Week 1

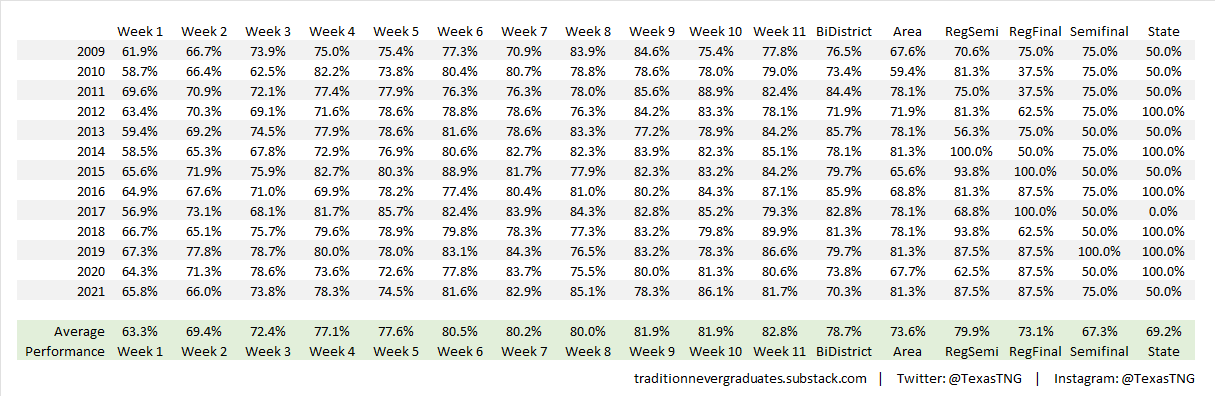
We expected Week 1 to be a difficult one for the model and that was indeed the case as it correctly picked 63% of the winning teams, which is in the typical range for how the model performed over the previous 15 years of our dataset (read more on our process here if you haven’t already). We’ll track the model’s performance each week and we should see it improve into the 80+% range in the latter weeks of the regular season.
Below, we’ll slice and dice the data from Week 1 to highlight some of the most interesting results.
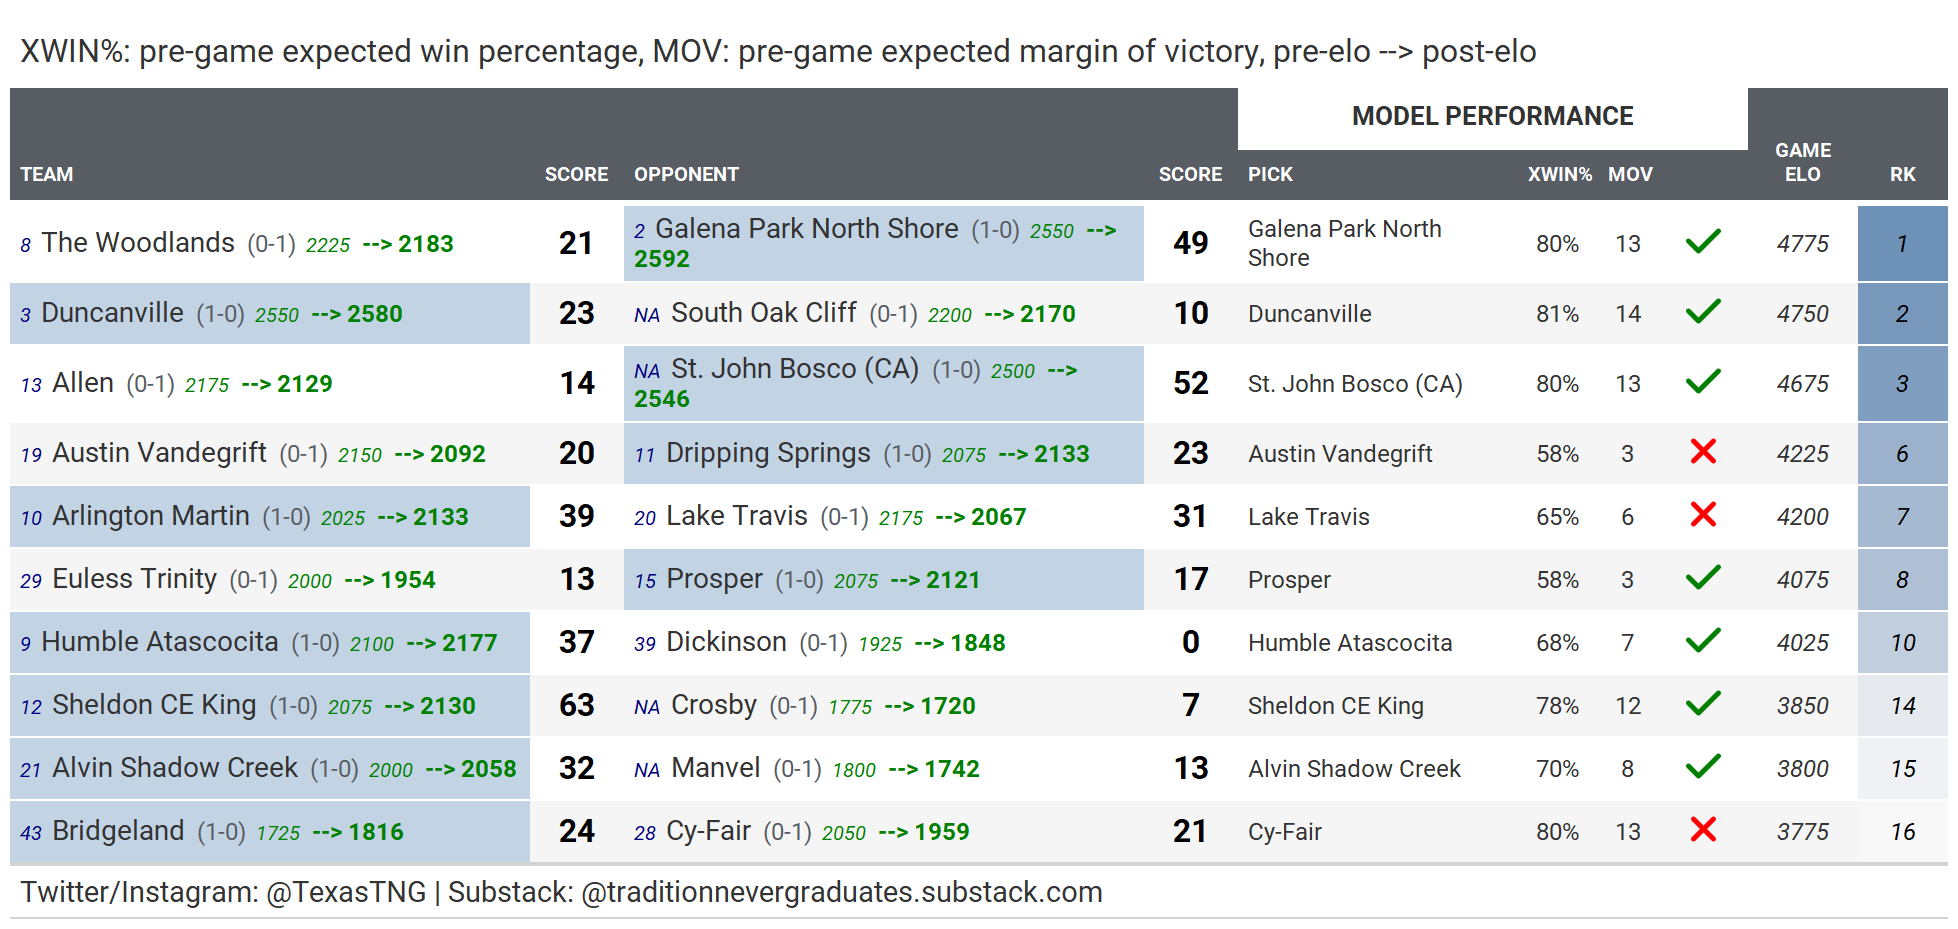
Top 10 Week 1 Matchups
Sorted on top combined elos + expected margin of victory of two touchdowns or less
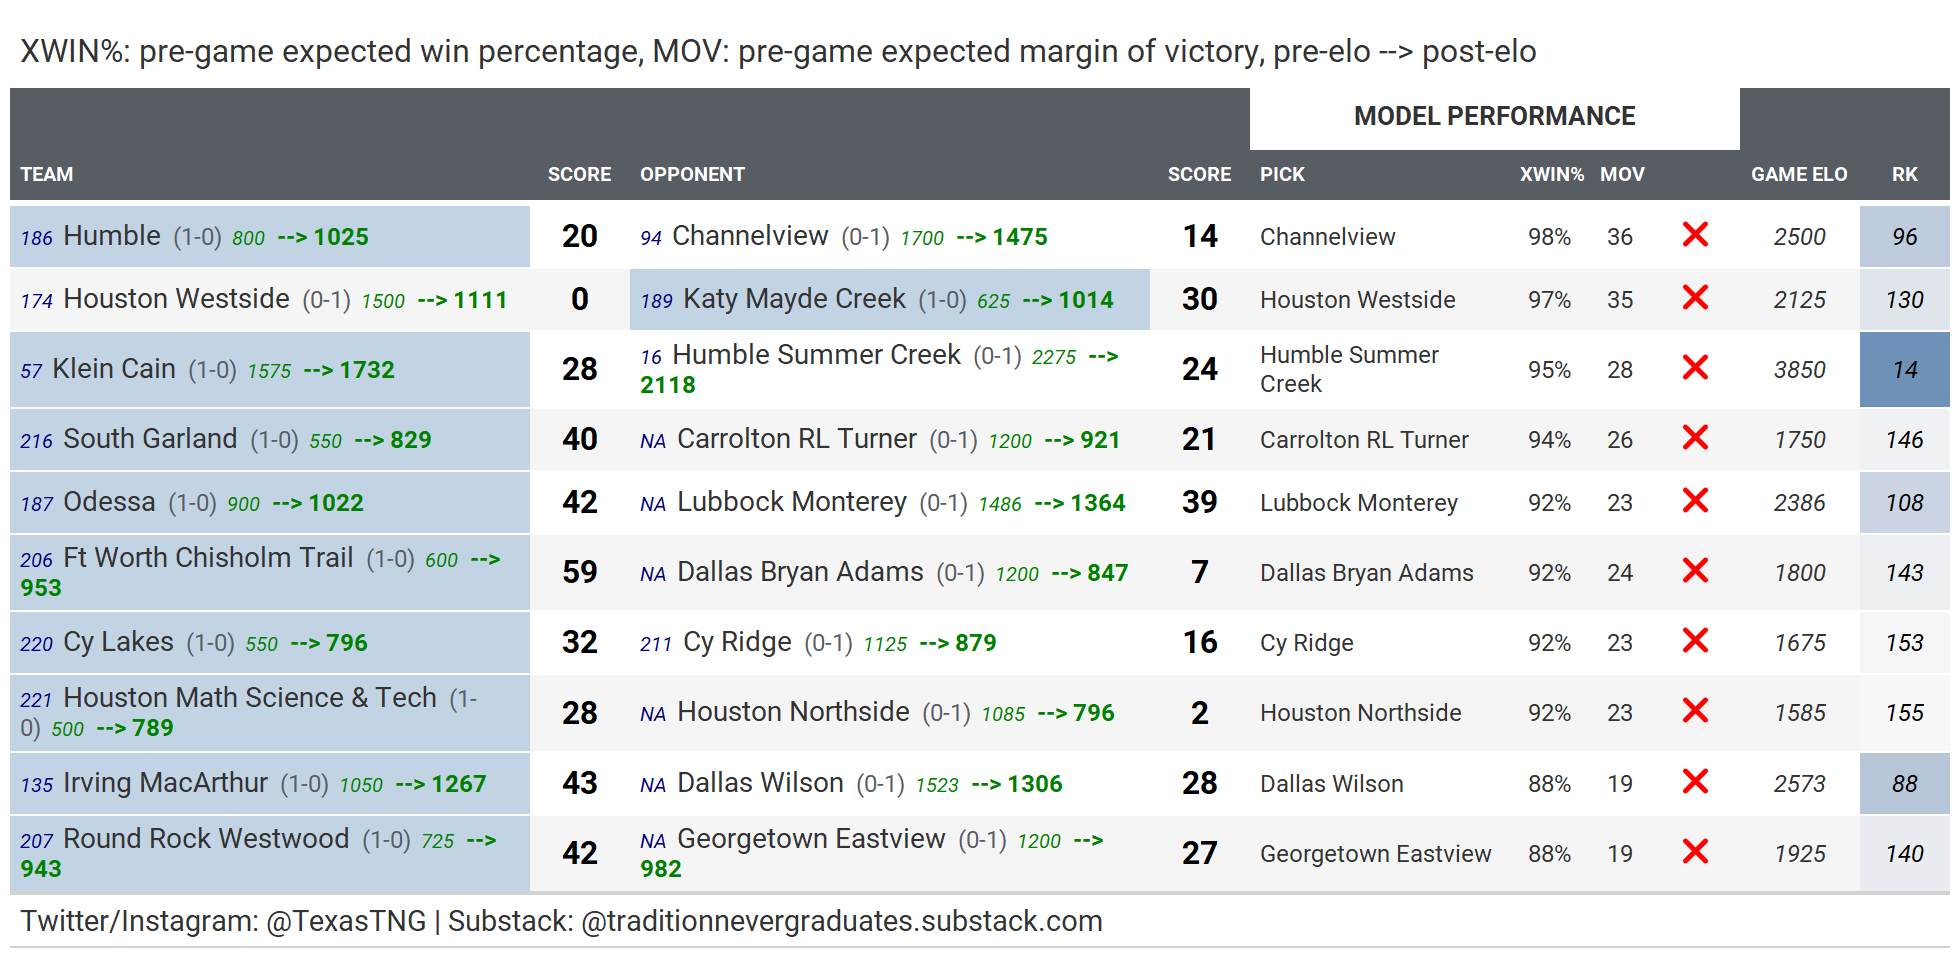
Top 10 Week 1 Biggest Upsets
Sorted by largest pre-game win probabilities of losing teams. For example, Channelview had a 98% expected win probability going into the game and lost to Humble by 6. As a result, Humble gained over 200 elo for outperforming expectations.
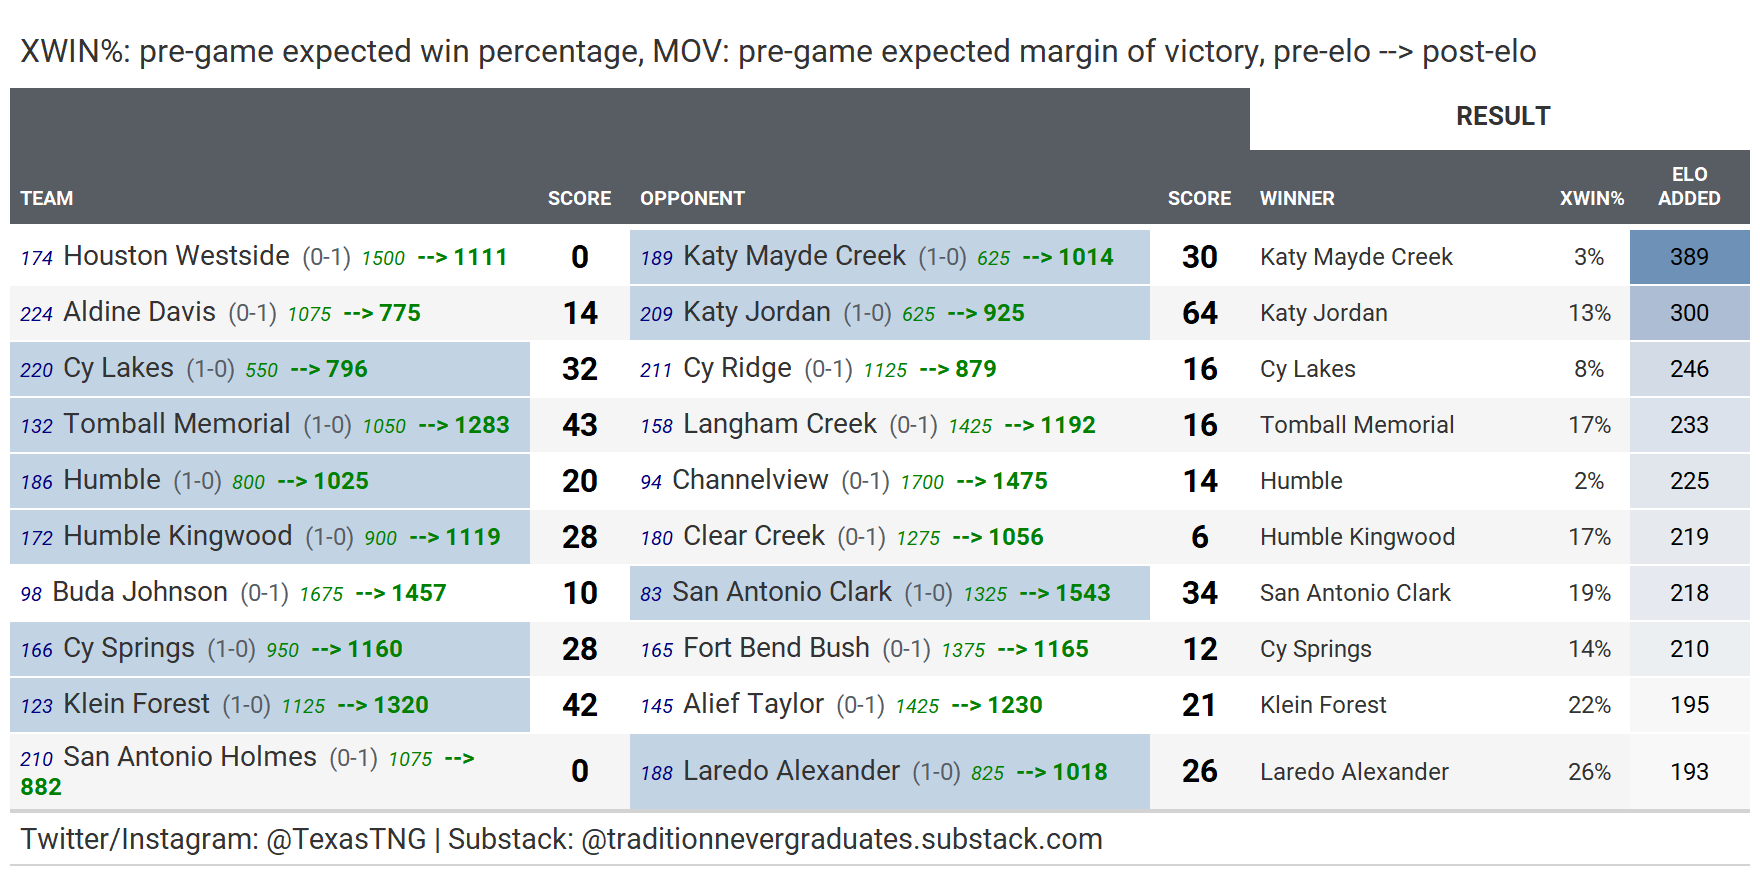
Week 1 Top 10 Largest Elo Points Added
Week 1 Top 10 Expected winners who outperformed
Filtered on expected win percentage > 50 %, sorted by most elo added
These are teams that came into the week expected to win their respective games, but still surprised to the upside by well outperforming their expected margin of victory (MOV).
ALL Week 1 Results
All game results below, including model performance, plus Elo rating changes (in green next to team name/record) from pre-game to post-game for every team.
Very cool, guys. I see my Dawgs improved to 1610 ELO. Let's goooooo! haha
B.E.A. utiful! Nice work brothers, and so interesting to follow along. One request? Can you make results sortable and searchable?!?! Even the browsers built in search functionality won't work on an image. =) Keep up the incredible work!