Performance Review: Week 2
Performance Review: Week 2
Slicing and dicing the data from Week 2

As expected, we saw a sizable increase in model accuracy in Week 2 as it correctly picked 69.3% of the winning teams which is right on the average of the model’s performance in prior Week 2s, as we can see in the table below (read more on our process here if you haven’t already). It could’ve been an even better week for the model if not for 11 games counting as incorrect model picks in which a single-digit favorite lost by just a single-digit score. In these cases, the model was right to project a close game, but just barely missed on the winner.
We’ll continue to track the model’s performance each week and we should see it improve into the 80+% range in the latter weeks of the regular season.
Below, we’ll slice and dice the data from Week 2 to highlight some of the most interesting results.
Top 10 Week 2 Matchups
Sorted on top combined elos + expected margin of victory of two touchdowns or less
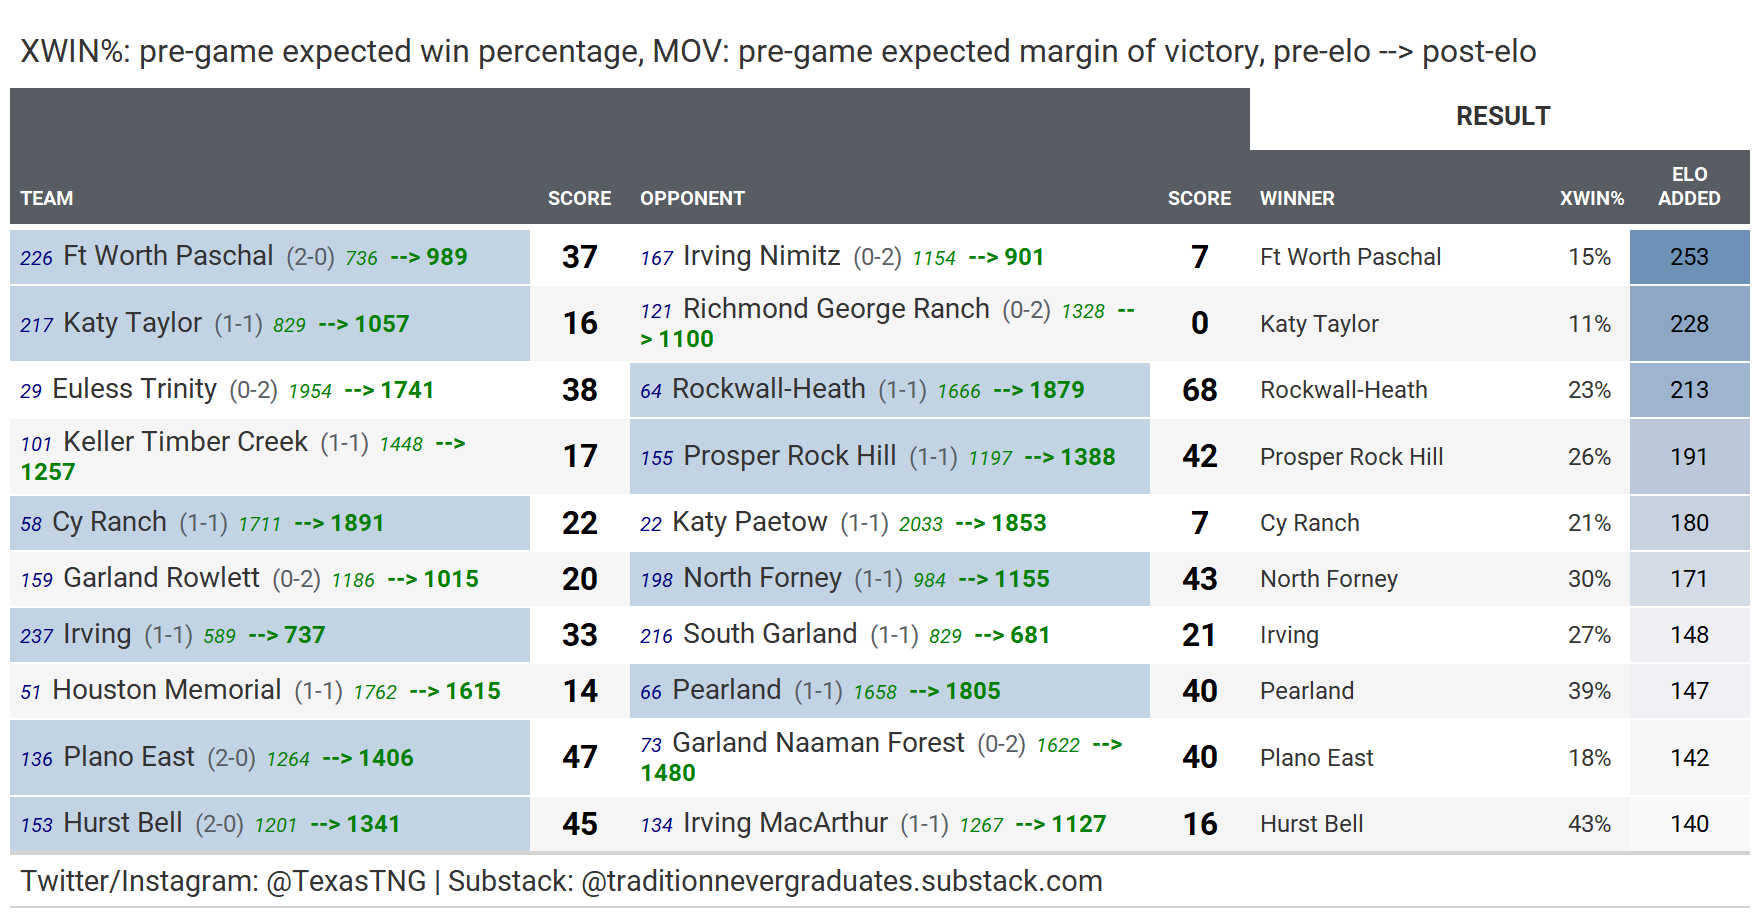
Top 10 Week 2 Biggest Upsets
Sorted by largest pre-game win probabilities of losing teams. For example, San Antonio Lee had a 90% probability to lose this week, but won by two touchdowns. As a result, Lee gained over 200 elo for outperforming expectations.
Week 2 Top 10 Largest Elo Points Added
Week 2 Top 10 Expected winners who outperformed
Filtered on expected win percentage > 50 %, sorted by most elo added
These are teams that came into the week expected to win their respective games, but still surprised to the upside by well outperforming their expected margin of victory (MOV).

ALL Week 2 Results
All game results below, including model performance, plus Elo rating changes (in green next to team name/record) from pre-game to post-game for every team.