

Performance Review: Week 3
Performance Review: Week 3
Slicing and dicing the data from Week 3's action

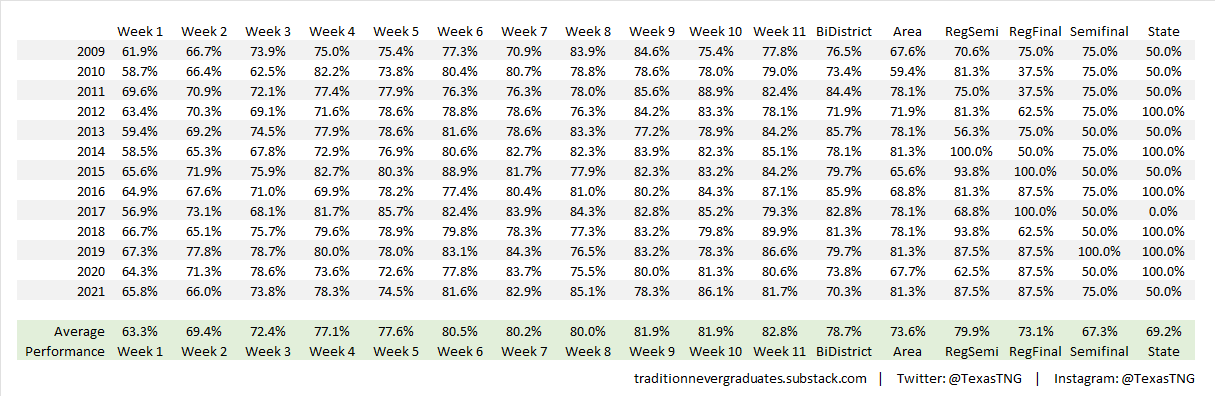
We continue to see the model accuracy more or less following right along with the 14-year averages, outlined below. This week, it correctly picked 74.1% of the winning teams (read more on our process here if you haven’t already). In addition, the model correctly identified 25 single-digit Week 3 contests that ended up finishing as single-digit games in reality, correctly calling the winner in 14 of those. Though that means that it picked the wrong winner 11 times, it shows that the model was right to have those teams rated close to each other.
We’ll continue to track the model’s performance each week and we should see it improve into the 80+% range in the latter weeks of the regular season.
Below, we’ll slice and dice the data from Week 3 to highlight some of the most interesting results.
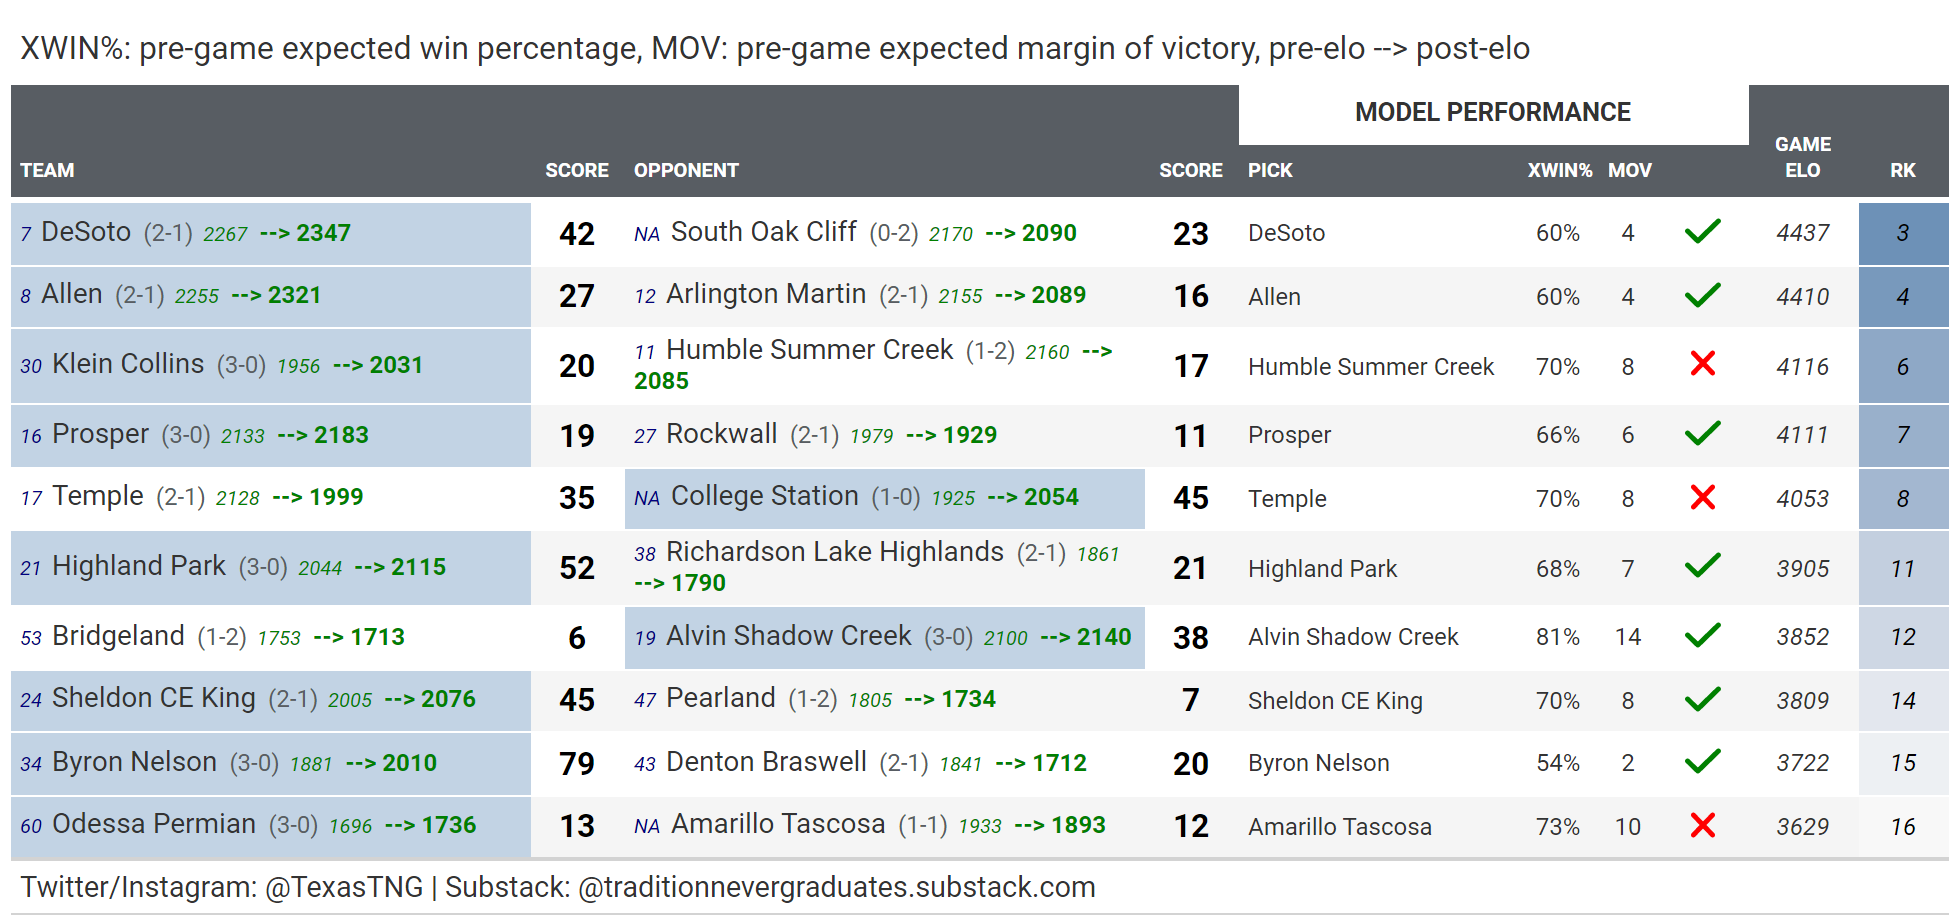
Top 10 Week 3 Matchups
Sorted on top combined elos + expected margin of victory of two touchdowns or less
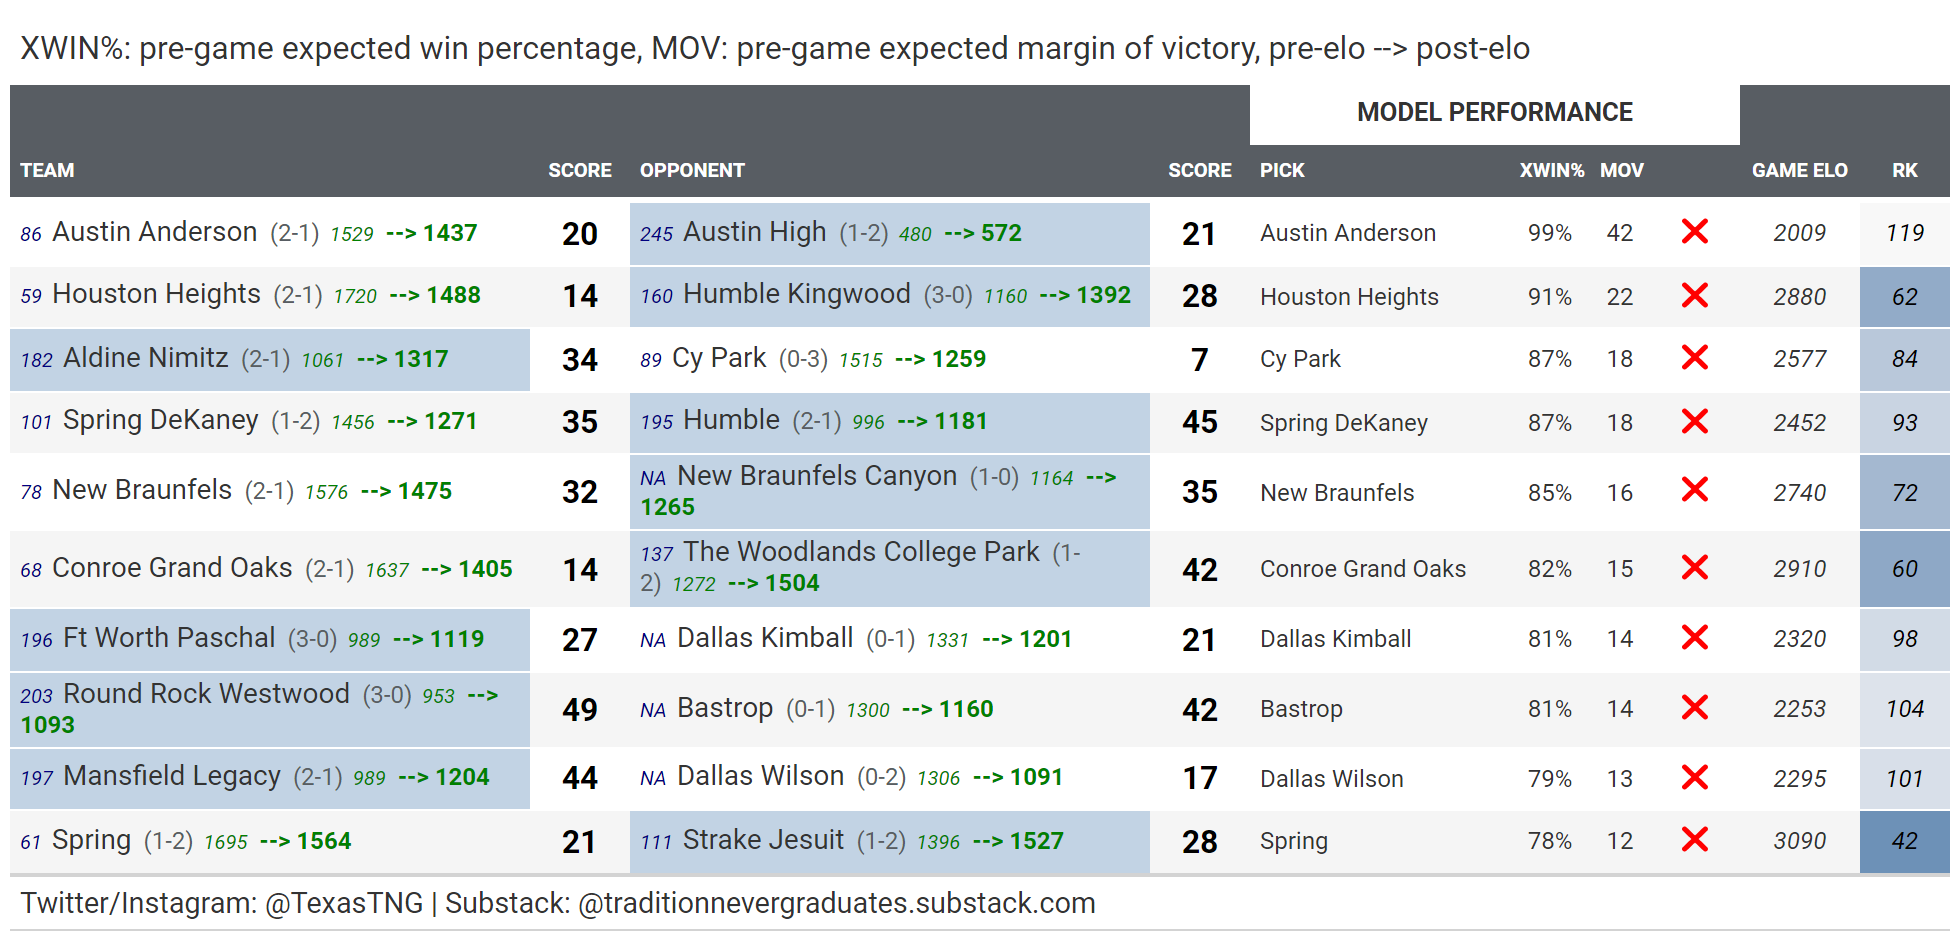
Top 10 Biggest Upsets
Sorted by largest pre-game win probabilities of losing teams. For example, Kingwood had a 91% probability to lose this week, but won by two touchdowns. As a result, Kingwood gained over 200 elo for outperforming expectations.
We need to take a minute here to appreciate the top-rated upset on the list below. Austin High entered their game against Anderson as a 42 point underdog, rated 1000 Elo points below them, with far less than 1% odds to win. In fact, in 19,784 games in our database from 2008 to 2021, no team had ever won a game when rated more than 1000 Elo points below their opponent. The only comparable analog we could find was a 2012 Klein Forest vs Spring Dekaney Week 4 game won by Klein Forest who was, at the time, rated 993 Elo points below Dekaney. That would be the only game Klein Forest won that year, while Dekaney would finish 7-3. Awesome win for the Maroons!
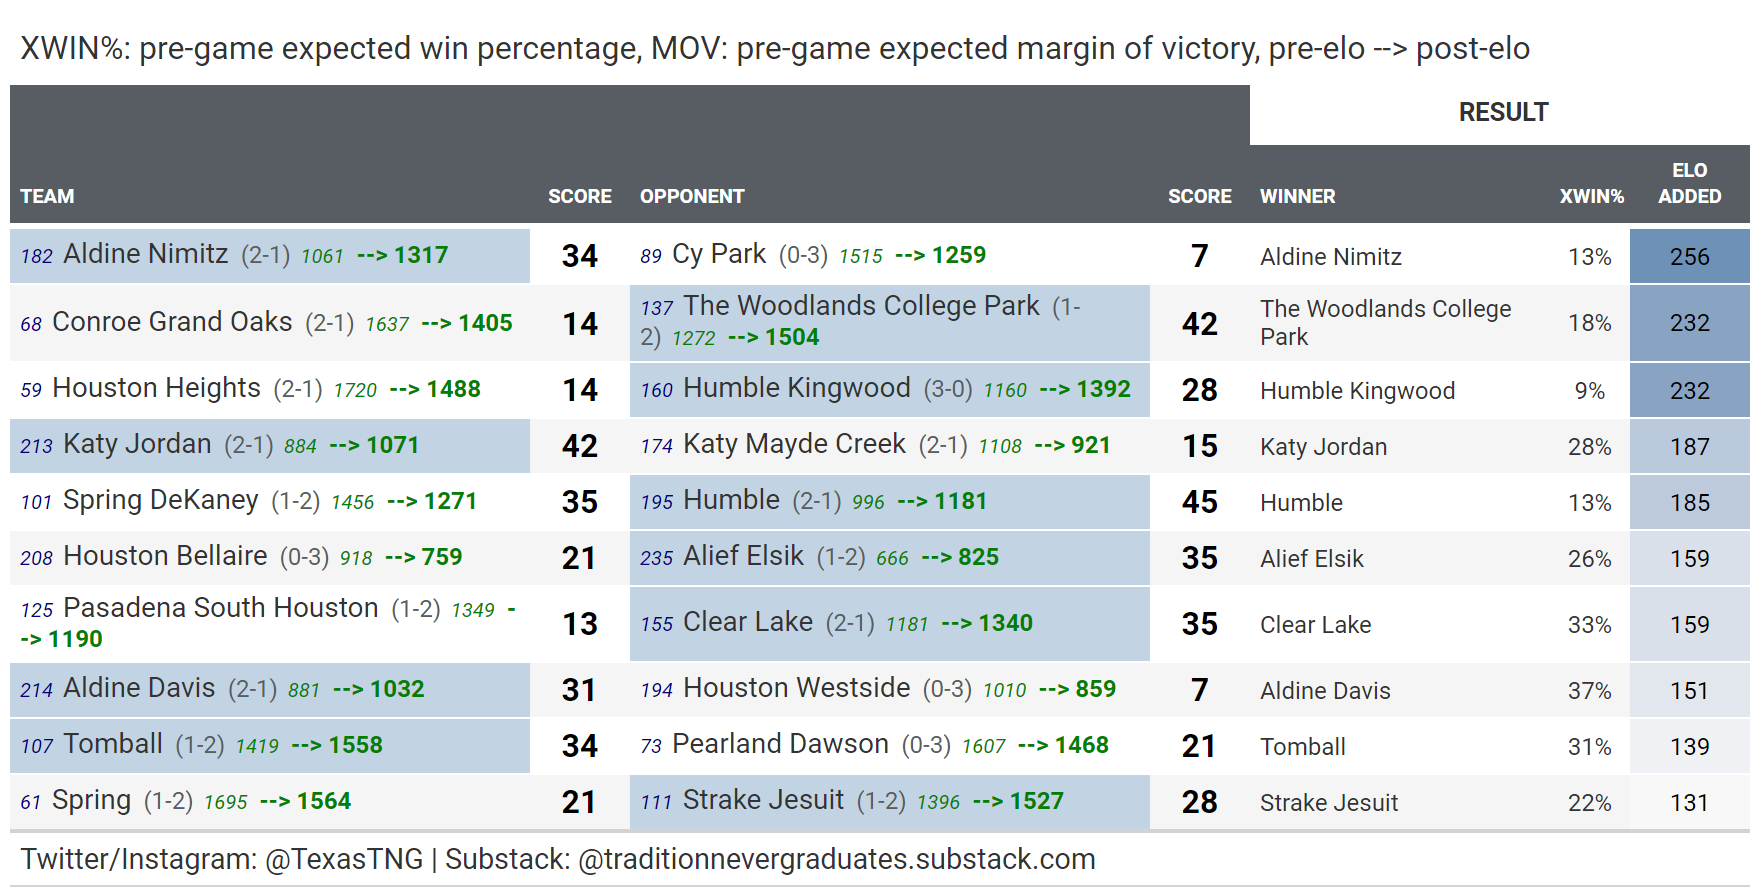
Week 3 Top 10 Largest Elo Points Added
Week 3 Top 10 Expected winners who outperformed
Filtered on expected win percentage > 50 %, sorted by most elo added
These are teams that came into the week expected to win their respective games, but still surprised to the upside by well outperforming their expected margin of victory (MOV).
ALL Week 3 Results
All game results below, including model performance, plus Elo rating changes (in green next to team name/record) from pre-game to post-game for every team.
Do y'all find it odd that the top 10 movers are all GHA teams? Why do you think that is?