Performance Review: Week 4
Performance Review: Week 4
Slicing and dicing the data from Week 4's action

Whereas last week the model performed above the historical benchmarks, we fell slightly below the pace in Week 4. This week, our model correctly picked 71.8% of the winning teams (read more on our process here if you haven’t already). As you can see in the chart below, our average performance in Week 4 was around 77%. The last time the model struggled this much in Week 4 was 2016, but the good news is that model performance in Week 5 in 2016 rebounded to 78%.
Looking a little deeper at what led to the lower performance last week, we had 10 of the 102 games in the Week 4 dataset that were projected to finish as single-digit games that did, in fact, finish as single-digit games. Rather incredibly, all 10 of those ended as incorrect picks for the model. If you recall, we had 25 of these games in last week’s dataset and the model went 14-11 there as opposed to 0-10 this week.
We’ll continue to track the model’s performance each week and we should see it improve into the 80+% range in the latter weeks of the regular season.
Below, we’ll slice and dice the data from Week 4 to highlight some of the most interesting results.
Top 10 Week 4 Matchups
Sorted on top combined elos + expected margin of victory of two touchdowns or less
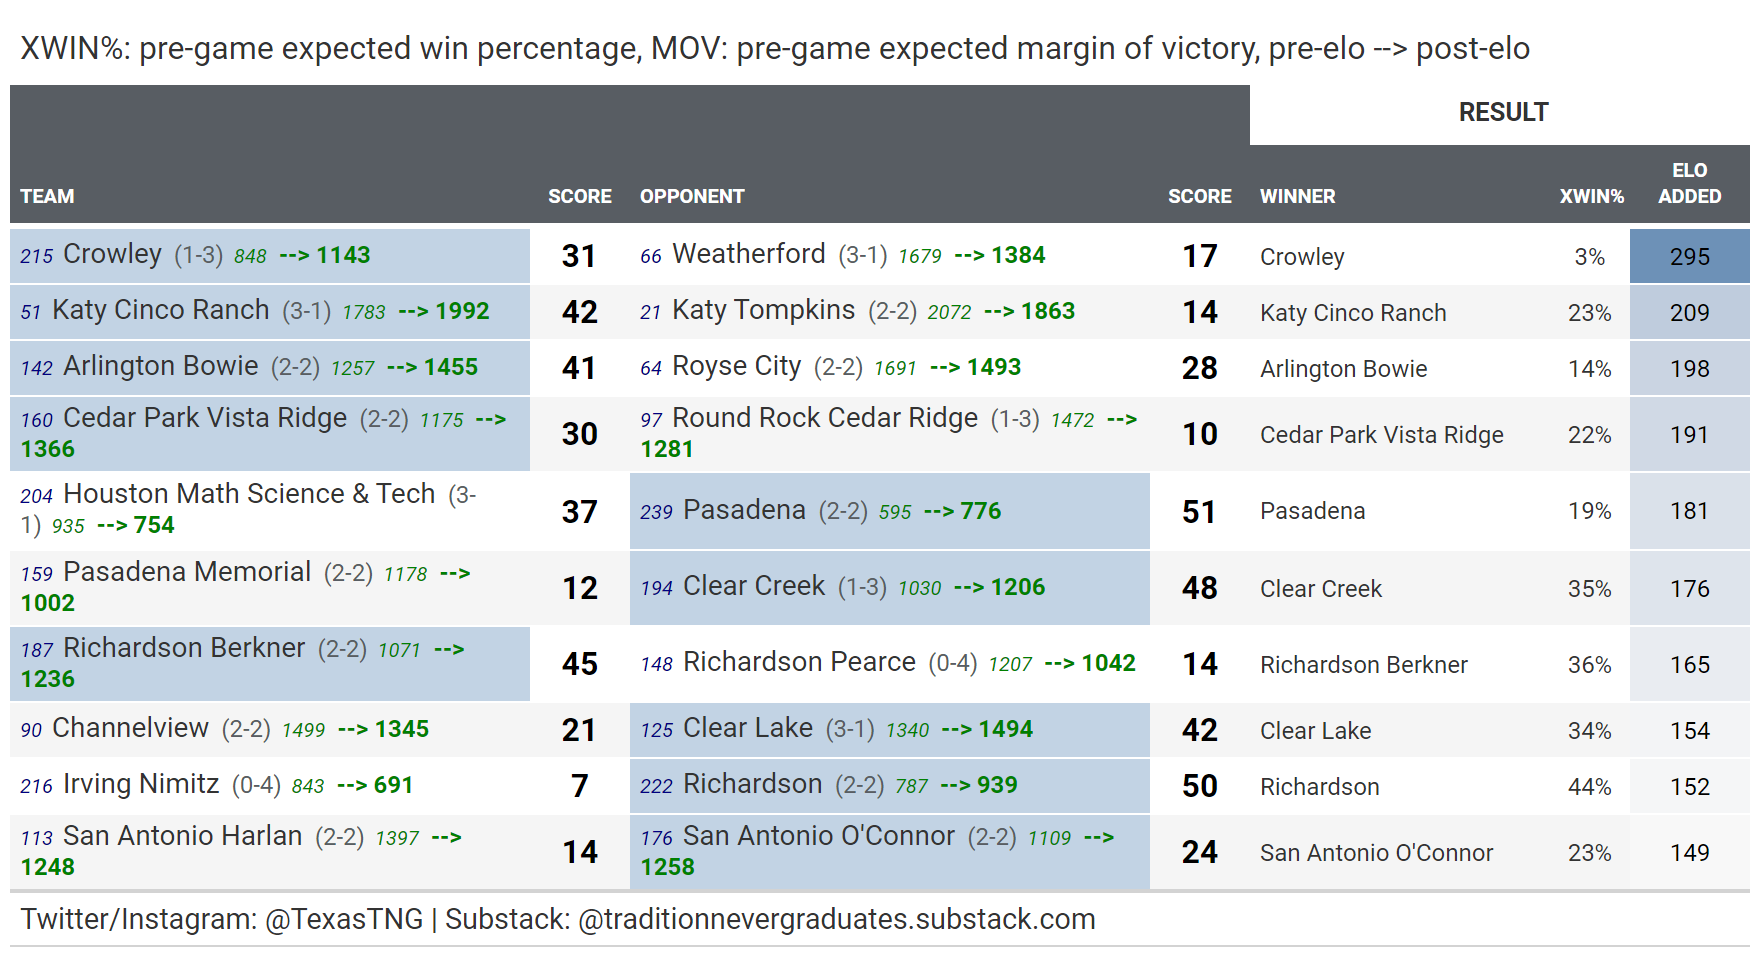
Top 10 Biggest Upsets
Sorted by largest pre-game win probabilities of losing teams. For example, Crowley had a 97% probability to lose this week, but won by two touchdowns. As a result, Crowley gained over 200 Elo for outperforming expectations.
Week 4 Top 10 Largest Elo Points Added
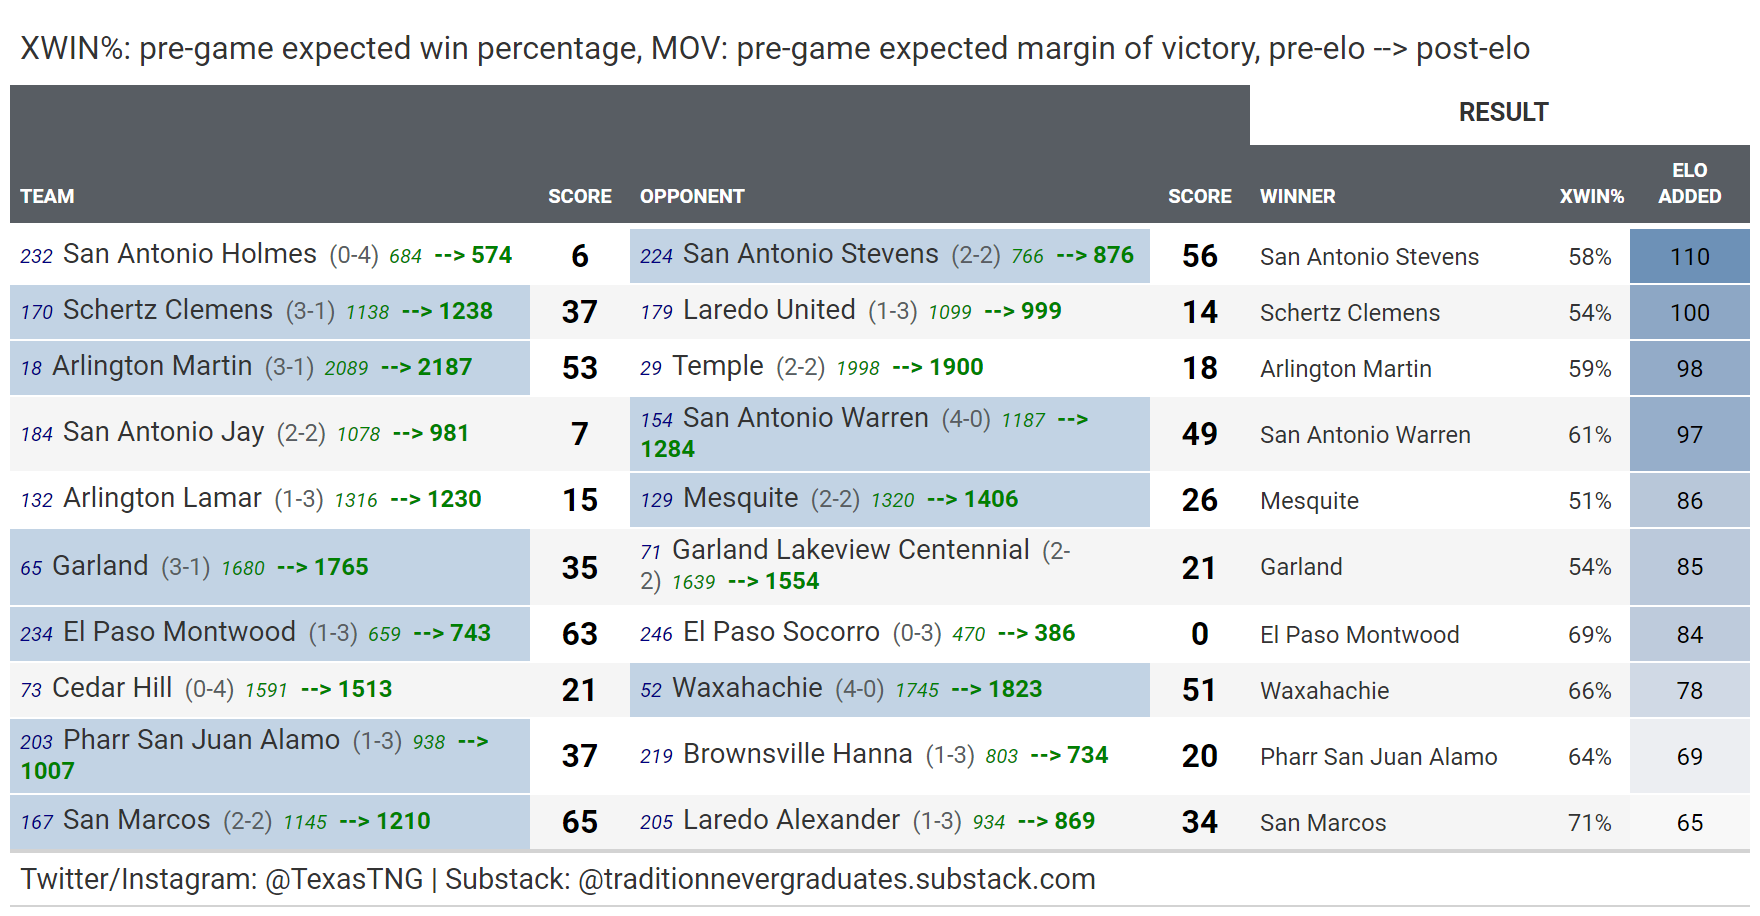
Week 4 Top 10 Expected winners who outperformed
Filtered on expected win percentage > 50 %, sorted by most elo added
These are teams that came into the week expected to win their respective games, but still surprised to the upside by well outperforming their expected margin of victory (MOV).
ALL Week 4 Results
All game results below, including model performance, plus Elo rating changes (in green next to team name/record) from pre-game to post-game for every team.