Performance Review: Week 9
Performance Review: Week 9
Slicing and dicing the data from the week's action

The model correctly picked 84.6% of this week’s winners (read more on our process here if you haven’t already). As you can see in the chart below, our average performance during Week 9 of the season was around 81.9%.
We’ll continue to track the model’s performance and hopefully we will continue stacking up weeks in the 80+% range.
Below, we’ll slice and dice the data from Week 9 to highlight some of the most interesting results.
Top 10 Week 9 Matchups
Sorted on top combined elos + expected margin of victory of two touchdowns or less
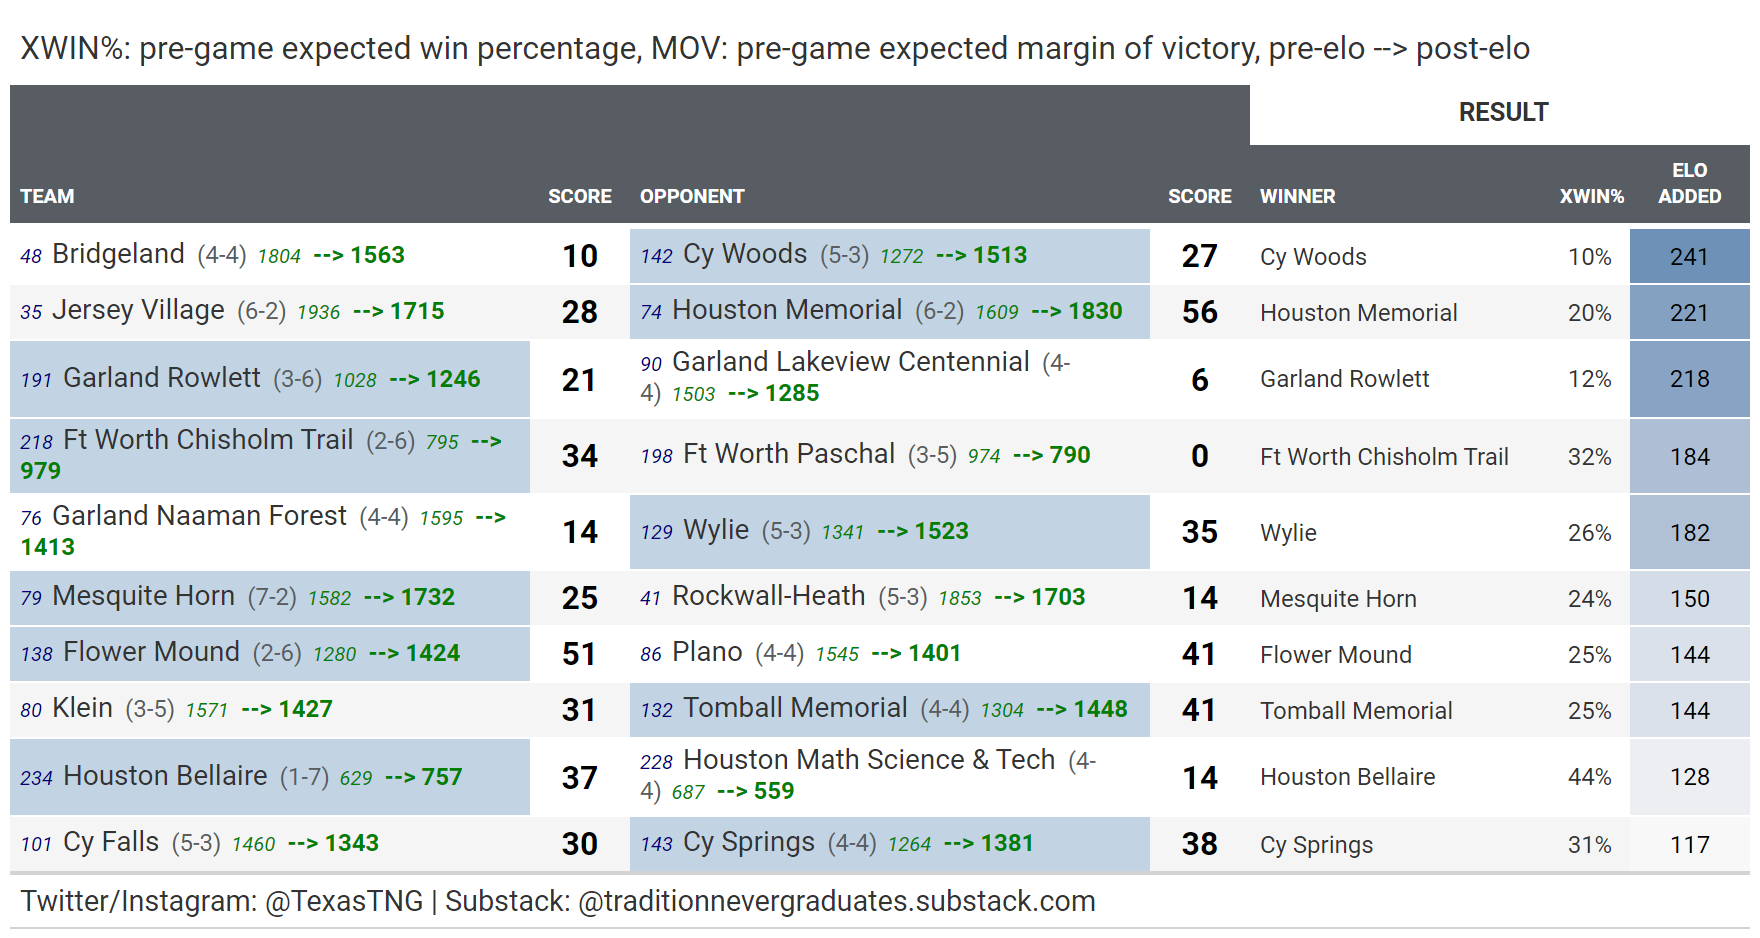
Top 10 Week 9 Biggest Upsets
Sorted by largest pre-game win probabilities of losing teams. For example, Cy Lakes had an 89% probability of losing this week, but won by two points. As a result, Cy Lakes gained 110 Elo for outperforming expectations.
Week 9 Top 10 Largest Elo Points Added
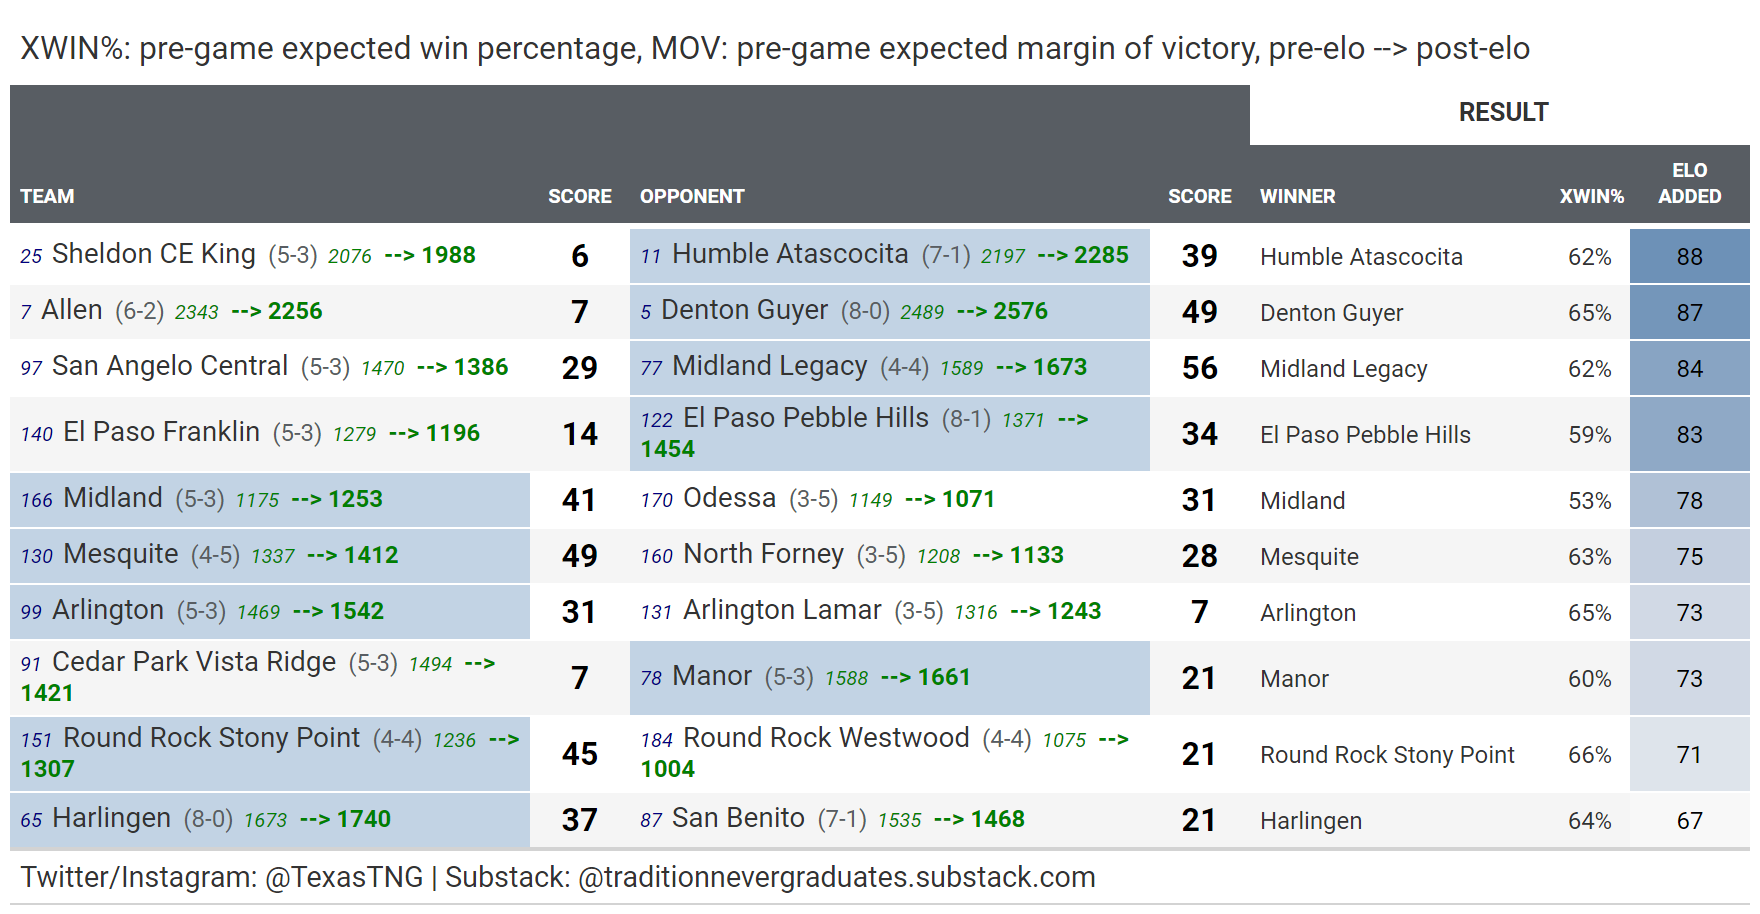
Week 9 Top 10 Expected winners who outperformed
Filtered on expected win percentage > 50 %, sorted by most elo added
These are teams that came into the week expected to win their respective games, but still surprised to the upside by well outperforming their expected margin of victory (MOV).
ALL Week 9 Results
All game results below, including model performance, plus Elo rating changes (in green next to team name/record) from pre-game to post-game for every team