

TNG Team Grades: State Semifinals
TNG Team Grades: State Semifinals
Grading every playoff team's performance so far in '22 against all seasons going back to '08.

Ever wondered how this season’s team performance stacks up against teams of the “recent” past? Wonder no more! Each week, we calculate the percentile rank of every team’s underlying metrics of adjusted offensive scoring (AOS), adjusted defensive scoring (ADS), and dominance (DOM) against every team from every season dating back to the start of the 2008 season (over 3,000 total seasons). This results in a 0-100 “grade” that gives historical context as to how well a team is performing on either side of the ball and as a whole. Also, these metrics have been adjusted for sub-regional strength to create a like-for-like comparison across the state.
Disclaimer: Numbers below are collected versus Texas 6A competition only.
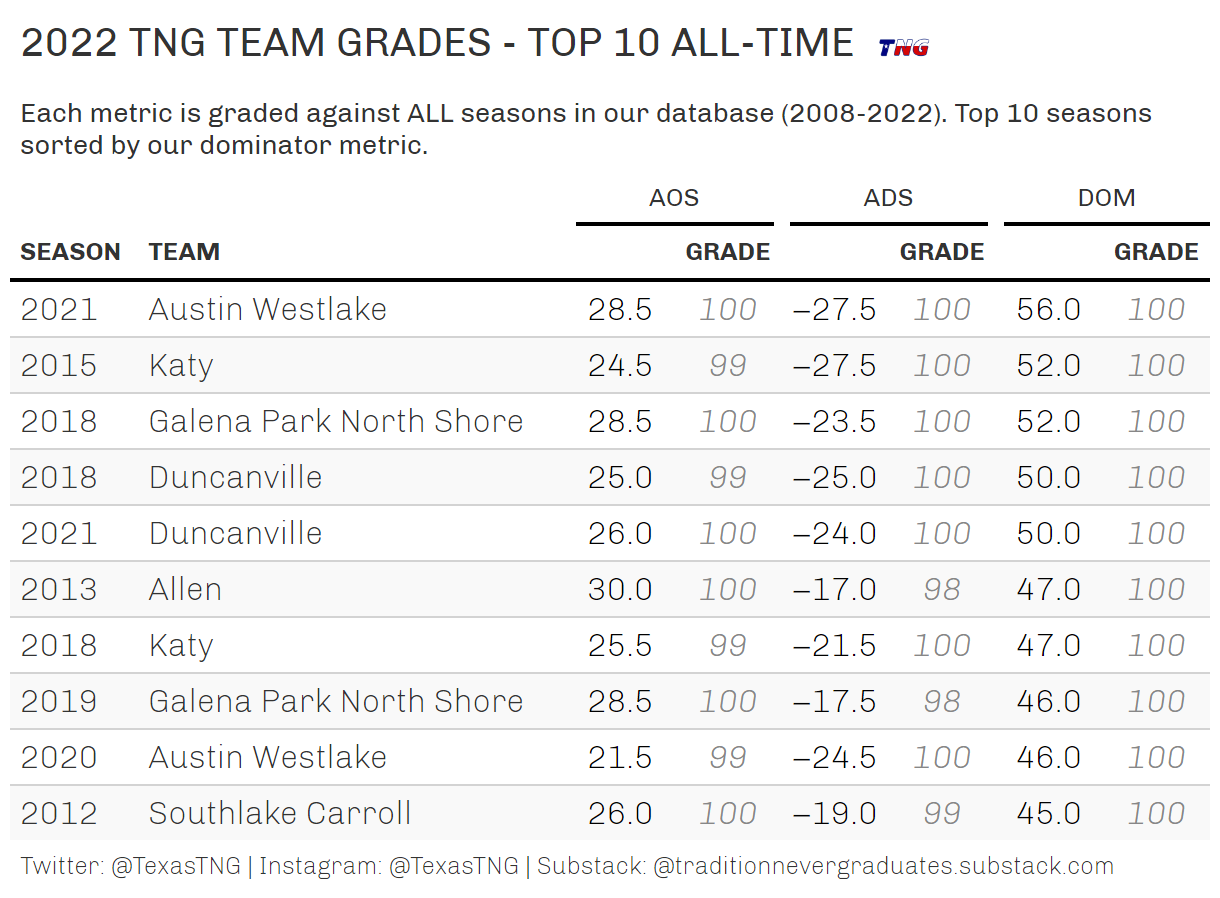
First, for some historical context, here are the ten best seasons we’ve ever recorded using our various metrics (sorted by overall dominance or DOM).
DIVISION 1 GRADES
In the table below, we’ve sorted the teams by current Elo rank with their underlying metrics to the right. This allows you to compare current season performance and units against other Division 1 teams.

DIVISION 2 GRADES
In the table below, we’ve sorted the teams by current Elo rank with their underlying metrics to the right. This allows you to compare current season performance and units against other top Division 2 teams.
