

TNG Team Grades: Week 9
TNG Team Grades: Week 9
Grading every team's performance so far in '22 against all seasons going back to '08

Ever wondered how this season’s team performance stacks up against teams of the “recent” past? Wonder no more! Each week, we calculate the percentile rank of every team’s underlying metrics of adjusted offensive scoring (AOS), adjusted defensive scoring (ADS), and dominance (DOM) against every team from every season dating back to the start of the 2008 season (over 3,000 total seasons). This results in a 0-100 “grade” that gives historical context as to how well a team is performing on either side of the ball and as a whole. Also, these metrics have been adjusted for sub-regional strength to create a like-for-like comparison across the state.
As mentioned in the post title, this is a new in-season feature that we plan to publish on Wednesdays.
Disclaimer: Numbers below are collected versus Texas 6A competition only. Due to some teams playing lower classifications and out-of-state opponents, season grades can be volatile early on. This is also why we try to wait until we’re solidly into the season before publishing these numbers.
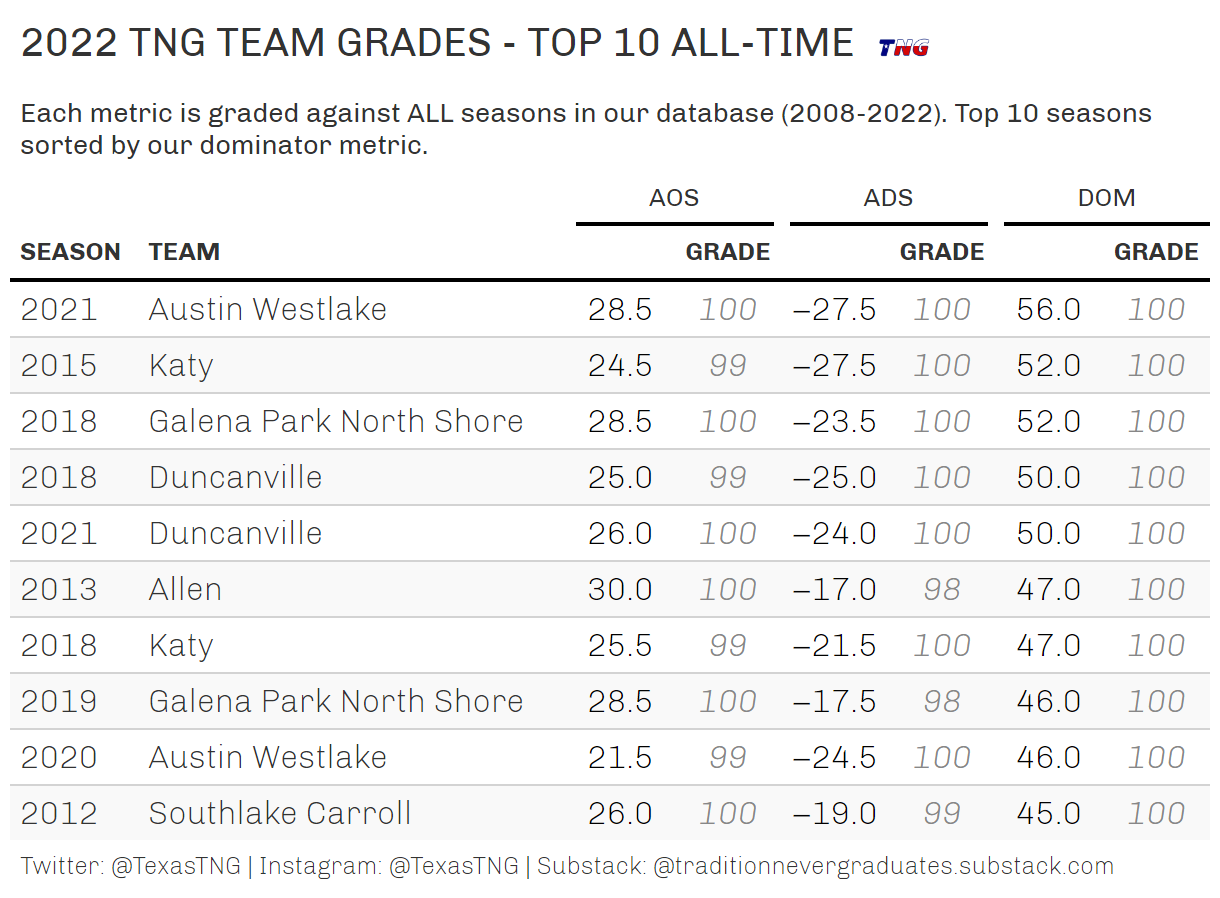
First, for some historical context, here are the ten best seasons we’ve ever recorded using our various metrics (sorted by overall dominance or DOM).
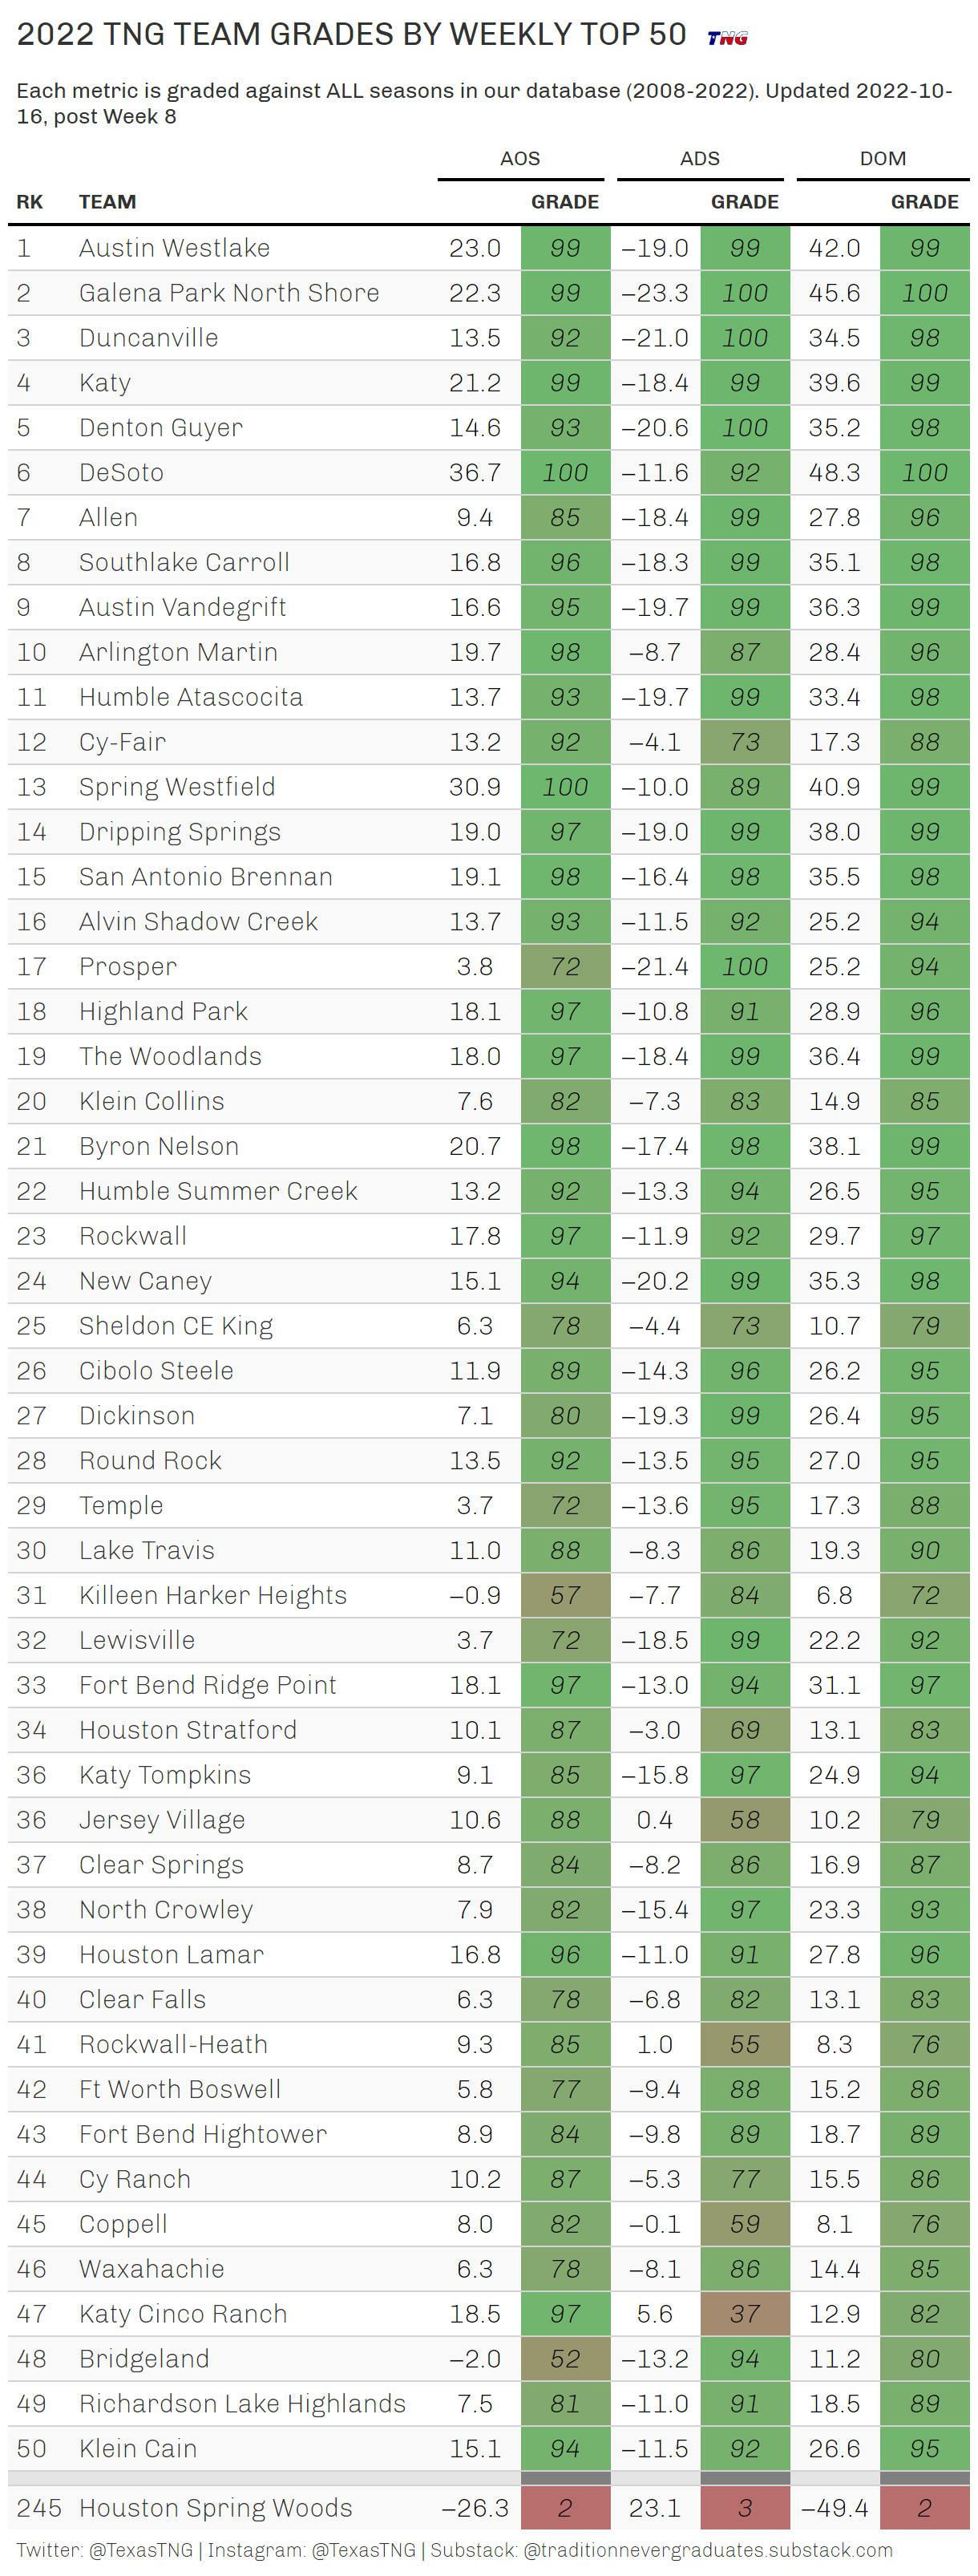
WEEKLY TOP 50 GRADES
In the table below, we’ve sorted the teams by current Elo rank with their underlying metrics to the right. This allows you to compare current season performance and units against other top ranked teams.
TEAM GRADES BY DISTRICT
The table below again shows the underlying team metrics and grades, except this time organized by all 32 districts. A few of the things that can be taken away from this visualization:
Overall District Strength - compare the colors of one district to another to compare, visually, if one district looks stronger than another. For example, compare district 21 (much stronger) to district 22. These two meet in 1st round of the playoffs.
District Depth - take a look within a district and if there’s a bunch of greens spread out across 4+ teams, that district could be considered really deep with good teams. For example, compare district 4 (top heavy) to district 24 or 25 (deep). Also, look at how cut and dried district 26’s top four teams are.
Unit Strength - compare offensive or defensive units across districts or teams within a district. For example, check out the difference between Rockwall-Heath’s (district 10) offensive and defensive units. Same with Prosper (district 5)

It appears I may have been wrong about the drop off at Westlake after losing Todd Dodge and Cade Klubnik. We will see more in the playoffs, but right now they still look like a machine.